About
U.S. government data from the NIH All of Us Research Program, the CDC, CMS, and the Census Bureau trains nine open models that share one scorer. This page has the data sources, the conditions, the models, the papers, and the team.
Data

All of Us is studied inside its secure Researcher Workbench, and only disclosure-checked aggregate results leave it. The CDC, Census Bureau, and CMS data are public files.
Data sources
Datasets
- NIH All of Us Research ProgramRegistered Tier Dataset v9: health records, surveys, and Fitbit data. Studied inside the Researcher Workbench; only aggregate results left it.
- CDC Household Pulse Survey, Post-COVID ConditionsLong COVID prevalence by state and by group, published by the CDC National Center for Health Statistics.
- Household Pulse Survey public-use filesSurvey responses reweighted to the All of Us cohort's makeup.
- National Health Interview Survey, 2023National prevalence of diagnosed conditions, for comparison with coded shares.
- NHANES, August 2021 to August 2023Measured hypertension and obesity, and diagnosed diabetes, for the same comparison.
- CDC Lyme disease surveillance dataReported cases by county, 2015 to 2019, for the Lyme disease card and the Atlas map.
- Census Bureau county population estimates, 2010 to 2019The denominators for county Lyme disease incidence.
- CMS Medicare Physician and Other Practitioners, by Geography and Service, 2024National Medicare allowed amounts for visits and tests, for the Atlas cost calculator.
- NIH RECOVERThe Long COVID symptom questions and research index in the patient app.
Standards and code systems
- HL7 FHIR R4The record format the apps and the scorer read.
- SMART App LaunchOpening the clinician app from inside an EHR.
- CDS Hooks 2.0The service that returns a card to the EHR.
- USCDIThe data classes read: problems, medications, laboratory tests, procedures, encounters, and demographics.
- ICD-10-CMDiagnosis codes, for model labels and chart findings.
- LOINCLaboratory tests.
- RxNormMedications.
- CPTProcedures and tests.
- SNOMED CTDiagnoses already recorded in FHIR charts, such as Long COVID.
How the numbers were made
All of Us lets researchers take only group counts out of its research enclave: counts from 1 to 20 are suppressed, and every other count is rounded up to the nearest multiple of 10. The models in this demo were fit outside the enclave from those released counts, so no patient-level data left it.
All of Us results on this site follow the program's Data and Statistics Dissemination Policy, and each public output is reported to the program before release.
Acknowledgment
We gratefully acknowledge All of Us participants for their contributions, without whom this research would not have been possible. We also thank the National Institutes of Health's All of Us Research Program for making available the participant data examined in this study. The All of Us Research Program is supported by the National Institutes of Health, Office of the Director: Regional Medical Centers: 1 OT2 OD026549; 1 OT2 OD026554; 1 OT2 OD026557; 1 OT2 OD026556; 1 OT2 OD026550; 1 OT2 OD 026552; 1 OT2 OD026553; 1 OT2 OD026548; 1 OT2 OD026551; 1 OT2 OD026555; IAA #: AOD 16037; Federally Qualified Health Centers: HHSN 263201600085U; Data and Research Center: 5 U2C OD023196; Biobank: 1 U24 OD023121; The Participant Center: U24 OD023176; Participant Technology Systems Center: 1 U24 OD023163; Communications and Engagement: 3 OT2 OD023205; 3 OT2 OD023206; and Community Partners: 1 OT2 OD025277; 3 OT2 OD025315; 1 OT2 OD025337; 1 OT2 OD025276. In addition, the All of Us Research Program would not be possible without the partnership of its participants.
Nine invisible illnesses
For each condition we measured, in the NIH All of Us Research Program, how often people in care for a diagnosis they report have its code in their record. For each of the nine we also built a model that finds people like them whose diagnosis is missing from the record.
| Condition | Have a code | Model | Clinician | Patient questions | Atlas |
|---|---|---|---|---|---|
| Infection-associated chronic illness | |||||
| Long COVID | about 1 in 9 | 0.67 | Card | RECOVER, DePaul, PCFS | Atlas |
| ME/CFS | 24% | 0.74 | Card | DePaul, IOM check | Atlas |
| Lyme disease | 39% | 0.65 | Card | Exposure questions | Atlas |
| Autoimmune | |||||
| Lupus | 69% | 0.82 | Card | not yet | Atlas |
| Chronic pain | |||||
| Fibromyalgia | 63% | 0.73 | Card | 2016 criteria check | Atlas |
| Migraine | 67% | 0.69 | Card | not yet | Atlas |
| Women's health | |||||
| Endometriosis | 41% | 0.61 | Card | not yet | Atlas |
| Mental health | |||||
| Depression | 68% | 0.76 | Card | PHQ-9 | Atlas |
| Anxiety | 68% | 0.79 | Card | GAD-7 | Atlas |
| For comparison | |||||
| Hypertension, type 2 diabetes | 85%, 87% | not applicable | not applicable | not applicable | not applicable |
AI models
Eight of the nine models are trained on patients' own reports that a clinician diagnosed them, instead of on diagnosis codes, so they learn to find people whose diagnosis was never coded. The Long COVID model is trained on a later Long COVID code. Each model is fit outside the All of Us Researcher Workbench from released aggregate counts, and one shared scorer runs all nine in the clinician app, the CDS Hooks service, and the patient app.
Training on patients' reports finds the uncoded
Show the numbers
Key figures
More results from the papers. Each figure links to the paper it comes from, where the full caption and methods are.
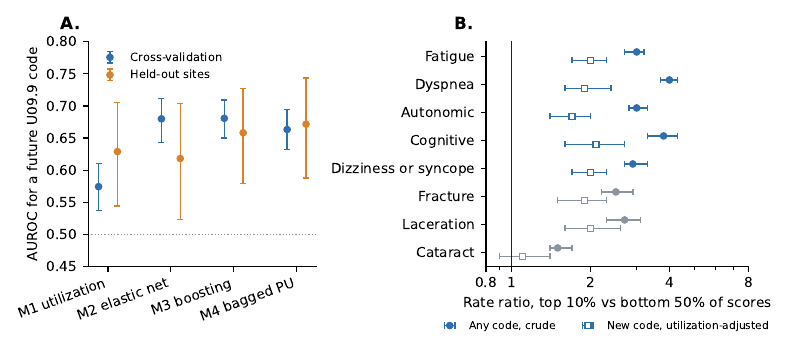
Early chart data modestly predict a later code
Models using the first 90 days after COVID-19 modestly predicted a later Long COVID code, in cross-validation and at 18 held-out sites. After adjusting for use of care, high scorers got new codes for unrelated conditions about as often as for Long COVID symptoms (rate ratios 1.2 to 2.1 and 1.8 to 2.1), so the score tracks documentation and use of care in general. From the Long COVID undercoding paper

The gap holds across groups and years of records
The low coding of contested conditions appears in every racial and ethnic group shown, and it closes only slowly as patients accumulate more years of records. From the self-reported diagnosis coding paper
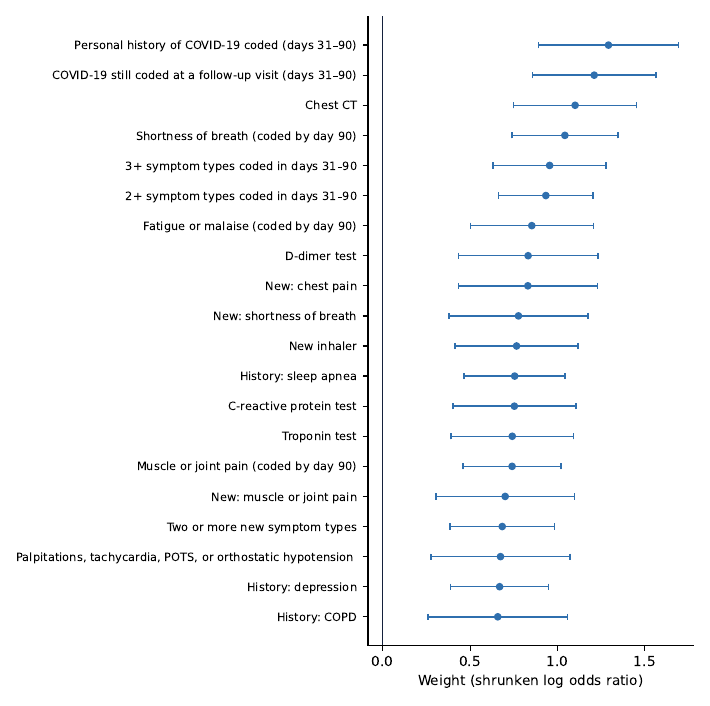
What moves the Long COVID score
The chart findings that raise the exported model's score most, led by a personal history of COVID-19 code and two or more symptom types coded in days 31 to 90. Each weight is what a finding adds to the score when it is present. From the Long COVID undercoding paper
Papers
Four papers by Amir Asiaee and Kaveh Aryan. Each is a preprint in preparation; the medRxiv link will appear here when it is posted.
-
Long COVID undercoding and early prediction of its documentation: survey comparison and an exportable model in the All of Us Research Program
How often Long COVID is missing from the record and for whom, and whether early chart data can flag patients before the code appears, with a model that can leave the research enclave.
Preprint in preparation; medRxiv link here when posted
- Paper (PDF, 25 pages)
- Supplement (PDF, 18 pages)
- Draft for review, October 2026
-
Electronic Health Record Coding of Self-Reported Diagnoses in the All of Us Research Program
How often the record carries a diagnosis that patients say a clinician gave them, for ten conditions, including chronic fatigue, fibromyalgia, endometriosis, and Lyme disease.
Preprint in preparation; medRxiv link here when posted
- Paper (PDF, 20 pages)
- Supplement (PDF, 14 pages)
- Draft for review, October 2026
-
Self-reported diagnoses as training labels for finding uncoded chronic fatigue, fibromyalgia, and endometriosis in the All of Us Research Program
Whether models trained on patients' reports of a diagnosis, instead of on diagnosis codes, rank higher the people who report a diagnosis but have no code for it. The chronic fatigue (ME/CFS) and fibromyalgia cards in this demo use these models.
Preprint in preparation; medRxiv link here when posted
- Paper (PDF, 16 pages)
- Supplement (PDF, 16 pages)
- Draft for review, October 2026
-
Design and Technical Evaluation of a Standards-Based System That Delivers Enclave-Derived Case-Finding Models to Patients and Clinicians
The system behind this demo and its testing on synthetic records: versioned model files, one scorer shared by the patient app, the clinician app, and a CDS Hooks service, and the Atlas of aggregate results.
Preprint in preparation; medRxiv link here when posted
- Paper (PDF, 20 pages)
- Draft for review, October 2026
Team
-

Amir Asiaee
Team lead, models and All of Us analysis
Department of Biostatistics, Vanderbilt University Medical Center
-

Kaveh Aryan
Clinician and patient applications, EHR integration
Department of Informatics, King's College London
Built for the HHS/NIH TOPx Tech Sprint, Invisible Illness track, October 2026.
Contact: [email protected]